
About Me
Hi, I'm Ed Gonzalez
I am a versatile developer and data analyst with deep expertise in back and front end development. Leveraging over a decade of experience, I specialize in the development and delivery of data analytic solutions as stand-alone web applications to plugin/extensions for popular BI and Reporting tools such as Tableau, PowerBI, and Cognos. I approach every project with creativity, maturity, and professionalism to deliver elegant solutions with positive outcomes.

My Current Activities
Projects: I'm workig with a major auto component manufacturer to develop a regional roadmap for reporting and data analytics . My role is pretty hands-on—I’m mentoring developers, providing support for current data analytic needs, and overseeing the migration from a legacy reporting environment to a more modern stack. We’re using Tableau for front-end reporting, and it’s been exciting to see how this transformation enhances the team's insights and capabilities!
Personal Development: Lately, I’ve been reading a variety of books, like Infectious Generosity and Change by Design. These books are sparking new ideas about innovation and leadership. On the side, I’m keeping up with some favorite podcasts like Think Fast Talk Smart, How I Built This, and Chisme Corporativo. They help keep me inspired and grounded.
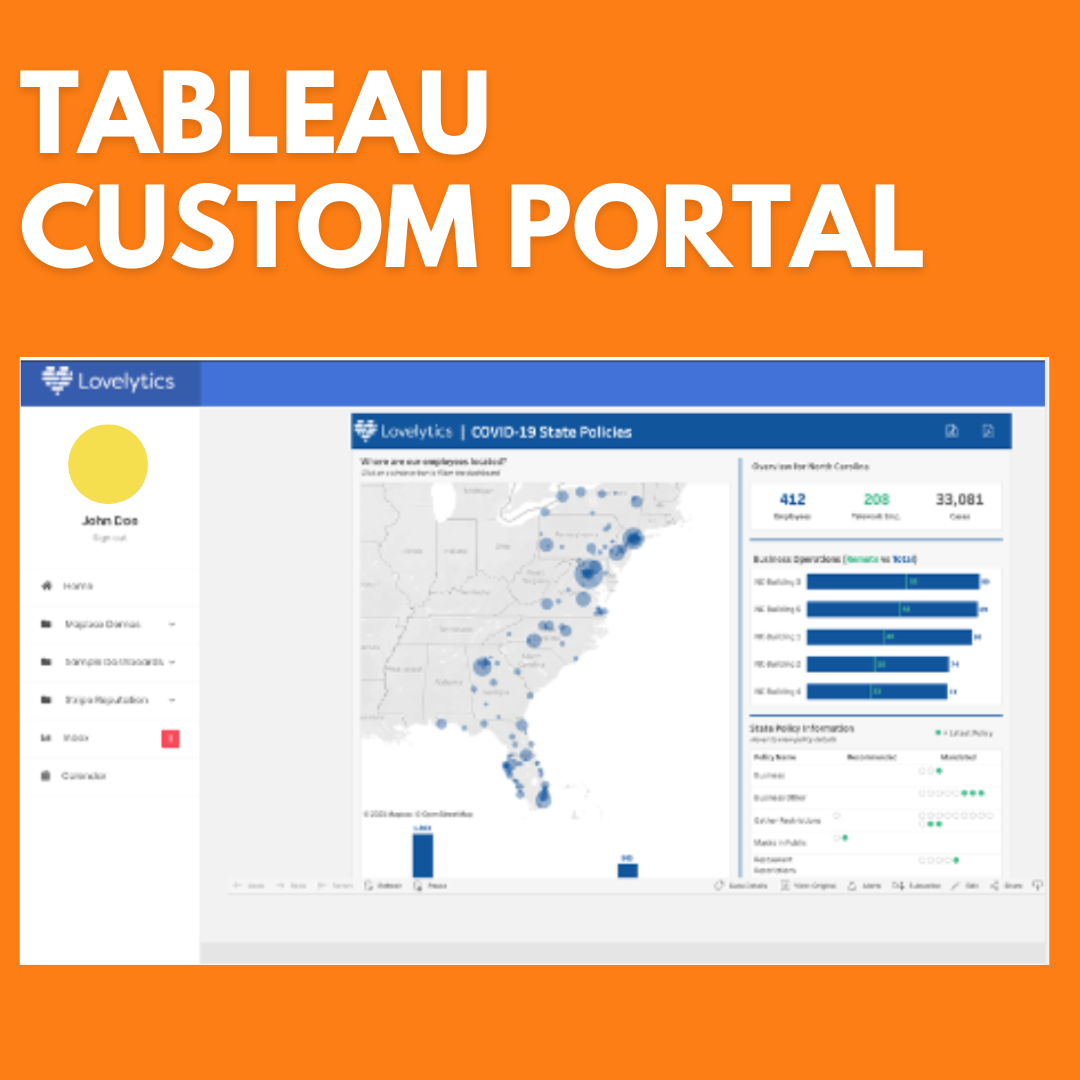
Knowledge Sharing: I’m always on the lookout for opportunities to share knowledge. Recently, I had the chance to present at the Tableau Conference 2024, discussing how to use Tableau APIs with Mapbox. I’m also refactoring some of my POCs and demos to share on GitHub stay tuned!
Continuing Education: Right now, I’m diving deep into AI tools like Claude and ChatGPT, specifically exploring their APIs. I’m integrating these into custom applications to streamline data analysis workflows enhance data cleansing processes. The possibilities here are endless, and I’m eager to see where this leads!

Name:
Ed Gonzalez
Email:
What I do?
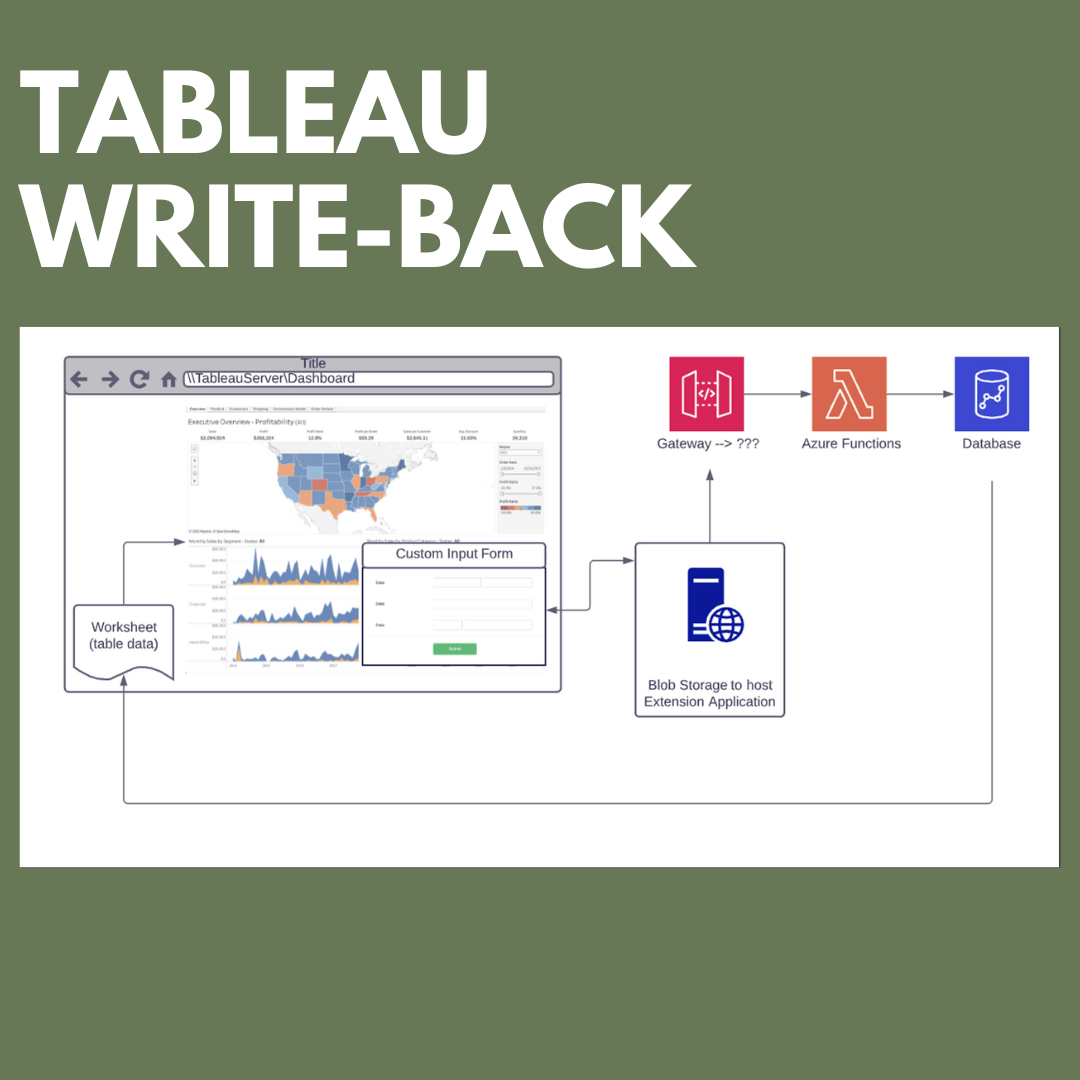
Tableau APIs
Using the rich Tableau APIs, I can automate workflows and migrations, embed dashboards into 3rd party apps and websites, and create impressive custom visualizations to extend the Tableau offerings.
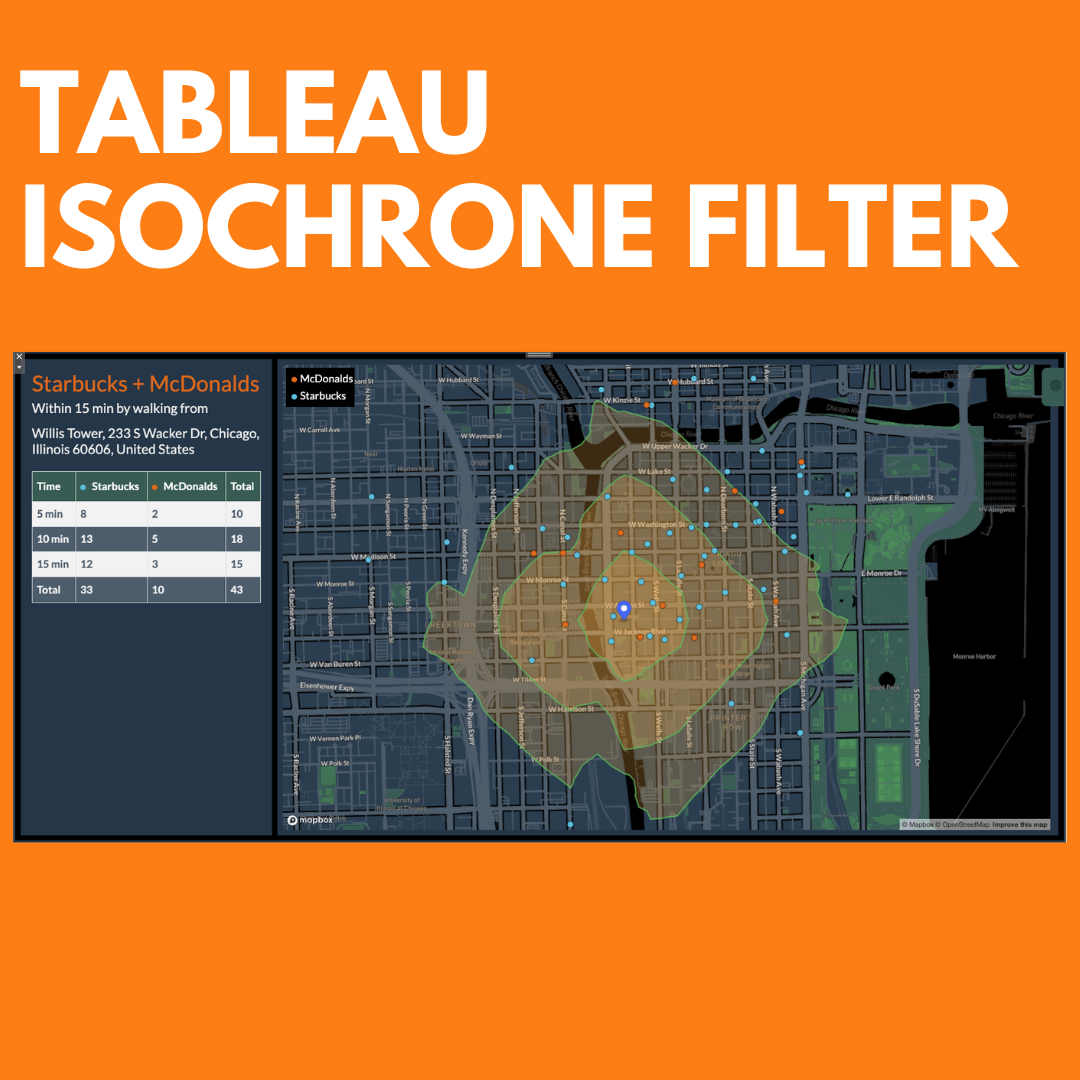
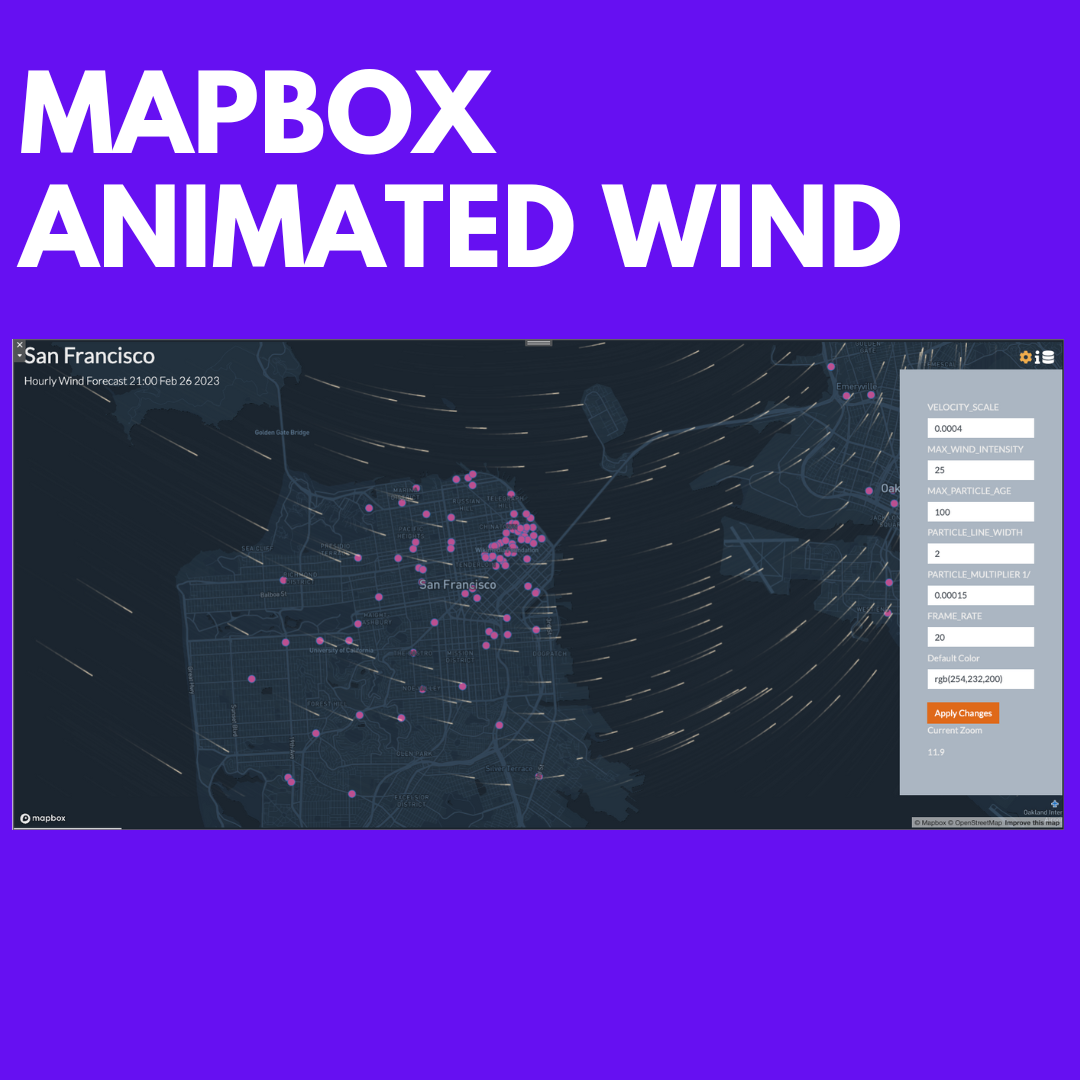
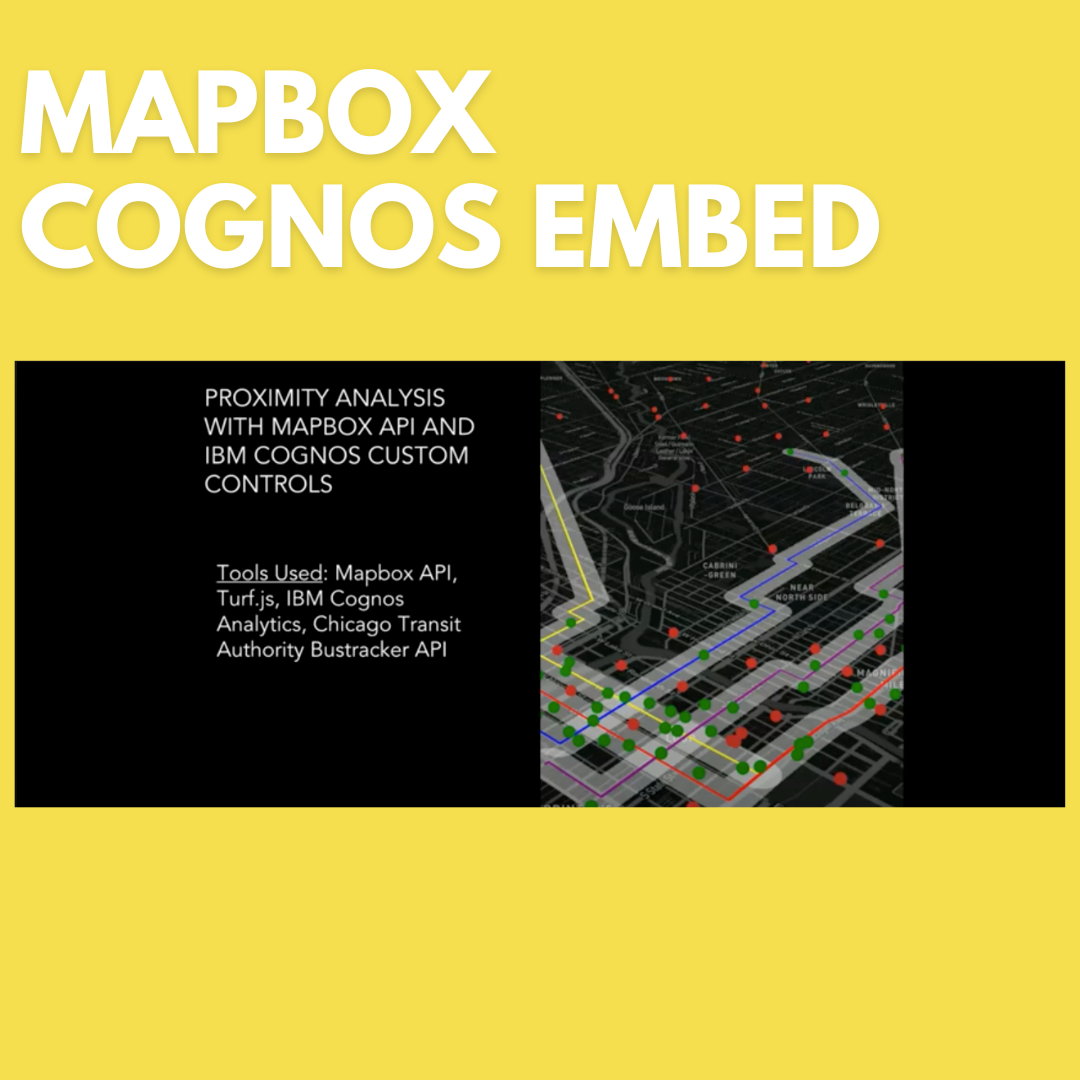
GeoSpatial Analytics
With a deep knowledge of Web Mapping tools and APIs such as Mapbox, Google Maps, and Leaflet. I can help add Advanced GeoAnalytic solutions to your Web Application or BI / Dashboarding Tool in the form of unique interactive visualizations or complete GeoSpatial applications to answer common spatial questions about location, proximity, and density.
Web Development
I am a full-stack developer ready to jump in and start working on your project. I can help develop full multi-tier web apps to individual Front-End components using server-side frameworks such as NodeJs, Flask and FastAPI Framework, SQL DATABASE design, and Front-End development using HTML5, CSS3, JavaScript, and various Front-End Libraries.
Scripting
Python is an incredibly versatile language for many tasks, including automation, connecting to APIs, and migrating data. I can use Python and a variety of libraries to help streamline repetitive tasks and reduce the potential for human error, connect to APIs to interact with a wide variety of web services, read, transform, and write data in a wide variety of formats and migrate data between different systems, regardless of the format or structure of the data.
Custom Data Visualizations
Using JavaScript and various visualization libraries such as D3.js, I can help create unique interactive visualizations and incorporate them into your web application or as an extension to your preferred BI / Dashboarding tool such as Tableau, PowerBi, IBM Cognos.
Data Engineering
As a data engineer for analytic data applications, I've designed and built data pipelines to move and transform data from various sources, as well as developed APIs and other interfaces to allow data analysts and scientists to access and analyze the data. I worked closely with many data teams to understand their requirements and develop solutions that meet their needs. This involved collaborating on data modeling, ETL processes, and data architecture design.
Resume
Recent Experience
Lovelytics
As the VP for Custom Development, my primary responsibility is to lead and
grow our team of developers who specialize in developing Data Analytic applications and
extending the capabilities of existing BI Tools such as Tableau, PowerBI, and IBM Cognos.
As VP of a growing practice, I had a personal target of 60% billable project work consisting of
Project lead and hands-on development. I would lead a team of developers and designers to
provide high-quality solutions that meet the client's expectations. I worked closely with the
team to design and develop scalable and performant Data Analytic applications, many integrated
with various BI Tools such as Tableau. Finally, I would work hand in hand with the team to code
and deploy solutions.
In addition to leading project work, I am responsible for business development activities. My
responsibilities included collaborating with our sales and marketing teams to identify new
business opportunities, develop proposals, and present solutions to potential clients. I also
participate in industry events, conferences, and speaking engagements to increase our visibility
in the market and establish our thought leadership in the industry.
Lovelytics
As part of admin and business development, I worked closely with the sales and marketing teams to identify new business opportunities and develop proposals and solutions to meet the needs of our clients. I also participate in business development activities such as networking events, conferences, and speaking engagements to raise awareness of our practice and generate new leads.
My billable project work included working closely with clients to understand their business requirements, identify their technical needs, and develop a roadmap for successfully delivering their projects. In addition, I would lead a team of developers and designers to provide high-quality solutions that meet the client's expectations. I worked closely with the team to design and develop scalable and performant web-based mapping applications integrated with various mapping APIs and geospatial data sources.
Avnet Technology Solutions
As a Solution Architect specializing in Business Intelligence and IBM Cognos, my role was to design, develop and implement effective BI solutions that enabled organizations to make data-driven decisions. I was responsible for analyzing business requirements and translating them into technical specifications, identifying the most suitable BI tools and technologies to meet those requirements, and designing the overall solution architecture.
Continuing Education
MIT Sloan Executive Education
Design thinking is a powerful process of problem solving that begins with understanding unmet customer needs. From that insight emerges a process for innovation that encompasses concept development, applied creativity, prototyping, and experimentation. When design thinking approaches are applied to business, the success rate for innovation improves substantially.
Harvard Extension School
Familiarizes the students with the most important information technologies used in manipulating, storing, and analyzing big data. We examine the basic tools for statistical analysis, R and Python, and several machine learning algorithms. We examine Spark Core, Spark ML (machine learning) API, and Spark Streaming which allows analysis of data in flight, that is, in near real time.
Harvard Extension School
Human visual system processes and perceives images, good design practices for visualization, tools for visualization of data from a variety of fields, and programming of interactive web-based visualizations using D3.
Past Projects

What People Say
Eric Wyant
Director, Business Intelligence Solutions at Lovelytics
Ed is an extremely bright and innovative business intelligence consultant. His knack for pushing the envelope with the Cognos Business Intelligence suite is second to none in the Northeastern Ohio area. He has provided our organization with mutliple options by leveraging many tools at his disposal; including the Cognos SDK, Cognos Mashup servces, and custom web/portal integration. He quickly earned the respect and confidence of the IntellisEPM development team and we plan to use his services extensively in the future.
JD Franco
Senior GeoAnalytics Developer
I worked under Ed’s leadership for four years. During this time, his dedication and commitment to not only sharing his technical knowledge, but also to empowering me to take command of my own field was monumental to my growth on our team. Ed fostered an atmosphere of curiosity and problem-solving on our team that was evident by the progression of the difficulty of projects that we acquired. I always felt confident in my ability to turn to Ed with any doubts or concerns, as he was always willing to share whatever skills or knowledge I needed to complete my task. Whenever we encountered a problem that we did not have the answer to, Ed would always take the time to sit down with me and carefully investigate the solution.
Matt Harris
Director, Data Solutions at Sirius Computer Solutions, Inc.
Ed is someone that I have worked with in two capacities with my past two previous companies being Avnet and UHC. Ed is a very experienced consultant and developer with a concentration in Business Intelligence using the IBM Cognos platform. Ed has always been fantastic to work with and what separates him from the pack is that he also has a strong programming and scripting language background that enables him to be valuable to an organization in a variety of development and visualization capacities. He has deep industry expertise, including insurance, banking, manufacturing, education and healthcare. Ed is great to work with and will bring value to any organization looking to benefit from his wide and unique talents.
Let's get in touch
I enjoy discussing new projects and solution challenges. Please share as much info as possible so we can get the most out of our first call.
Call:
(440) 409-7697